|
|
|


|
Main
Page by Topic |
||
|
C. Statistics |
||
Jigsaw Puzzle Model for a CTRM Solution
Overview
This page
introduces a model of a CTRM based on a jigsaw puzzle metaphor.
This model, in
this case meaning a visual representation for the way things
work, has some benefits in terms of facilitating communication. We’ll use the language of this metaphor to
make some important points below.
One key point
to make right now, which we’ll repeat and elaborate on below:
To
succeed, a CTRM solution just needs to cover the ‘core’ areas that a firm needs
as part of their overall technology solution. It
doesn’t need to do ‘everything’. Why is
that? Because that is the current model
for existing vendor-supplied CTRM solutions, at least at the larger firms using
CTRM.
Outline
1) Jigsaw Puzzle Model/Paradigm – Introduction and Commentary
2) Diagram 1 – Typical CTRM System Coverage for One Firm – Legacy
World
3) Diagram 2 – Typical CTRM System Coverage for One Firm – Legacy
World, high level/summarized
4) Diagram 3 – CTRM System Coverage for One Firm – Future State –
With NewCTRM Replacing Core
5) Diagram 4 – CTRM System Coverage for One Firm – Legacy and
Future State Side by Side
1) Jigsaw Puzzle
Model/Paradigm - Introduction and Commentary
Have a look at
each diagram and then read the text that follows for commentary.
Typical CTRM
System Coverage for One Firm – Legacy World
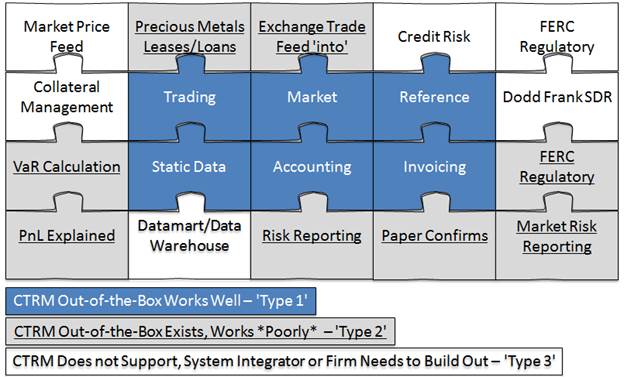
Commentary
1.1) The idea here is that the entirety of the diagram, the full
length and width, is what a firm needs for a software/technology solution to go
live, i.e., to have a working commodities trading solution at their firm. We’ll call this the ‘overall solution
landscape’.
1.2) With the overall solution landscape, we have different bits of
functionality. You could call these
‘components’ in a non-technical sense of the word. We have modeled these as pieces in a jigsaw
puzzle.
1.3) It should be understood that the modeling is somewhat
conceptual. The above diagram
suggest that each piece of the puzzle in the overall system landscape is
something you can swap in and out for another similar piece. i.e., ‘plug and play’.
1.4) While it can be tempting to read the labels of each of the
pieces and start to form conclusions, we’ll note that the labels, e.g., ‘PnL
Explained’ are just examples. The
specific features will vary from one firm to another. So we called this a ‘Typical’ example of
system coverage for one firm.
1.5) A key point that this diagram makes is with the center
pieces. Labeled ‘Type
1’ above. These are the things,
or meant to represent the things, that CTRM systems do well. These are also the most common functionality
and also that means the most commoditized, ‘least value add’
functionality. For example, this could
be modeling a financial commodity swap.
Pretty much every system is going to model these in a similar way, since
all of the firms are trading the same thing with one another.
1.6) The ‘Type
2’ items are features that are nominally supported by the vendor CTRM system,
but that it does not do them well. The
‘PnL Explained’ piece above is shown as an example of this. This is intended to be a typical example
that covers an average firm (system user) and average vendor. For another firm, they might find that the
PnL Explained offering from the CTRM system works great for them.
As an example,
Microsoft Windows comes with a program called ‘Paint’ (or ‘MSPaint’). It works fine for light graphical editing and
it’s free (included). However, it is no
match for a paid professional graphics software package.
With the
current typical landscape, firms can’t easy swap out, for example, the CTRM
vendor’s ‘ok’ PnL Explained for an alternate.
Though for most big CTRM systems, firms can invest in extensive
customization of the out-of-the-box version or even build their own tightly integrated
version. The problem here is, that if
you have 10 firms, they all might build out their own PnL Explained (or data
warehouse, etc.) solution so it gets somewhat inefficient.
With the new
model/paradigm for NewCTRM, we not only want to make it easy to ‘plug and
play’… we want to support an encourage an ecosystem
around the core NewCTRM solution where firms can build out new ‘pieces’ and
sell/license them. If we build out the
core parts, i.e., the common parts, the ‘least value add’ parts… we think the
market (i.e., entrepreneurial firms) will offer competitive solutions to fill
out the rest of the pieces. That is
something that is actively discouraged now by legacy CTRM vendors.
1.7) The ‘Type
3’ puzzle pieces in the diagram above represent features that a legacy CTRM
vendor doesn’t support, doesn’t have.
Remember though, we agreed a firm would need the entirety of the puzzle
to go live on commodities trading. So
if a CTRM vendor doesn’t have it, then in the current world, firms would need
to build it out from scratch. E.g., a
data warehouse (or ‘datamart’) is a good example of
that. We can assume that it is either
firms themselves or a system integrator (consultants) that build out the
missing pieces.
Typical CTRM
System Coverage for One Firm – Legacy World – High Level/Summarized
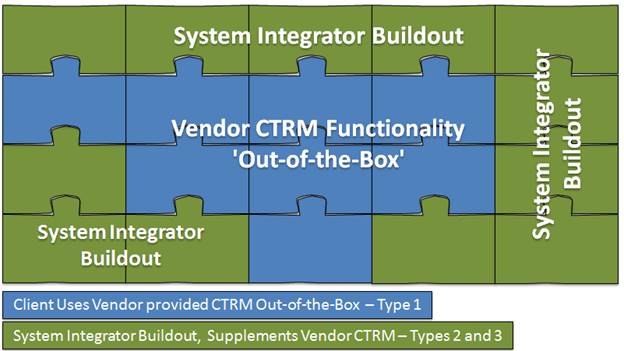
Commentary
2.1) This is meant to show the same concept as from ‘Diagram
1’. The difference here is that the
pieces are grouped together based on whether they are being met by:
2.1.1) The legacy CTRM vendor. These are the pieces in the middle,
noted as ‘Type 1’. This is the core
functionality that pretty much works the same for all vendors and clients.
2.1.2) Being built out by either a firm using the CTRM or the
System Integrator working for that client.
CTRM System
Coverage for One Firm – Future State – With NewCTRM Replacing Core
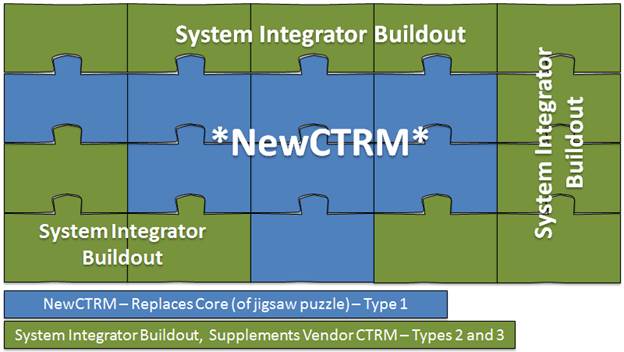
Commentary
3.1) This is meant to show the future state with the new ‘NewCTRM’
replacing the core pieces. This is a
good idea, since we already established that this part if the most common, meaning most commoditized functionality
and the least value add. This
can’t be a source of competitive advantage, since firms are already sharing the
same solution for this in the current world, i.e., from a common CTRM Vendor.
3.2) This shows that a CTRM solution doesn’t need to do
‘everything’. It can succeed and excel
just by doing the core/common features and it can be an improvement by being
more open and standardized.
3.3) You might call the above diagram ‘Phase 1’ for NewCTRM. This diagram is assuming that it basically
still the same amount of work to implement a NewCTRM as a traditional
vendor-supplied CTRM, meaning just as much custom buildout. However, it won’t need to be that hard. The market will be open for enterprising
firms to build instantly compatible ‘pieces’ of the puzzle. E.g., a best of breed interface from ICE (for
futures trades into the CTRM system) or a super-functional PnL Explained
reporting solution. With the ‘Phase 2’
model, the core CTRM could be thought of like ‘the App Store’ or a platform
like Windows, where there can be an ecosystem of competing products and
services that supplement the core NewCTRM.
This ‘Phase 2’ approach and benefits will be discussed in a future blog
post.
CTRM System
Coverage for One Firm – Legacy and Future State Side by Side
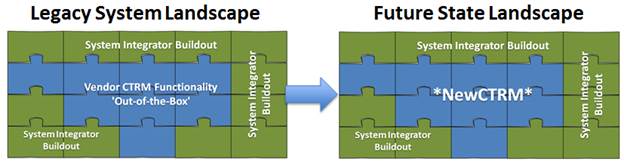
Commentary
4.1) This is just one more diagram, intended to summarize things
for you.
Introduction to
CTRM
Click on this
link for a great introduction to CTRM software: Introduction to CTRM Software